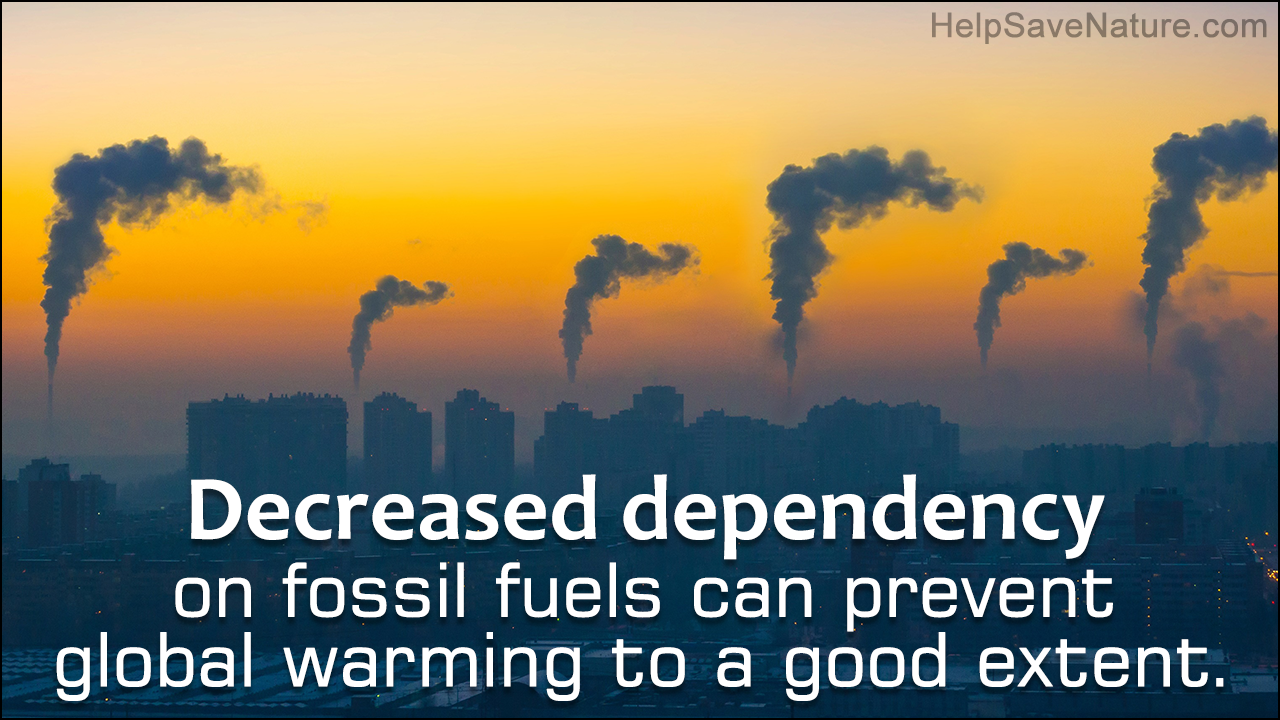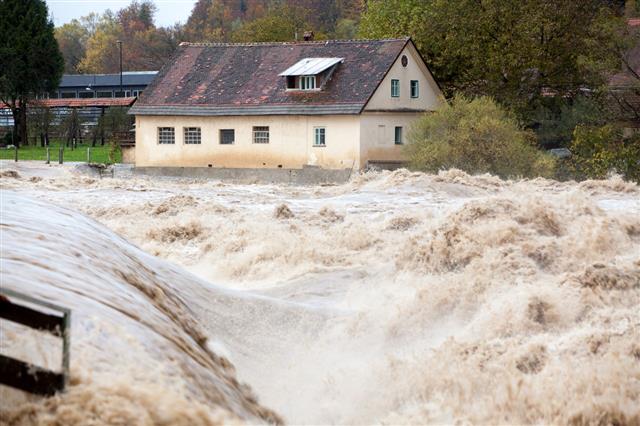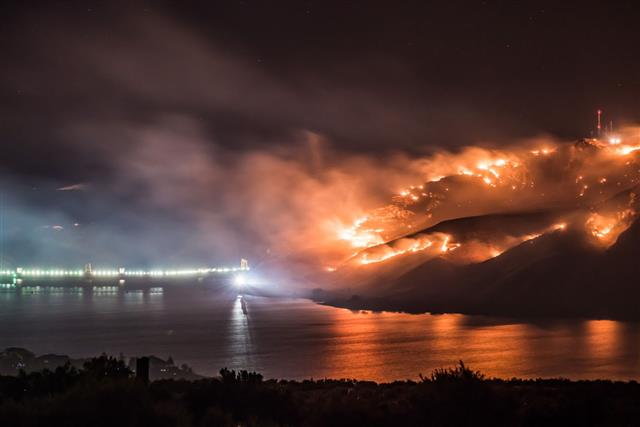
If you are finding it difficult to make sense of all the commotion on global warming and climate change, the statistics provided here will be of some help for you. An eye-opener for sure, especially for those who feel that the entire concept is hyped.
Fast Fact
In a Gallup poll taken in March 2013, 58 percent Americans said that they ‘worry a great deal’ or ‘fair amount’ about global warming.
Global warming has left the entire world divided into two groups. On one hand, we have the critics who think that the computer models used to study global warming and climate change, are too crude to be taken seriously. On the other, we have the scientists who claim that this phenomenon is real, and further add that, we need to find a solution for it as soon as possible. The end result is confusion all around, especially for those who are not familiar with geographical concepts and jargon.
We humans have been fueling global warming indirectly since a long time. While that might have something to do with our ignorance about the phenomenon, it’s high time we take a note of our misdeeds and restrain from fueling it. Without further ado, here are some numbers that are startling enough to be taken seriously.
Statistical Analysis of Global Warming
The statistical data compiled by the NASA Goddard Institute for Space Studies (GISS), which monitors global surface temperatures, has revealed that the average near-surface temperature of the Earth has soared by 1.4°F since 1880.
Even worse is the fact that the global temperature has started increasing at an alarming rate of 0.36°F per decade of late. If the GISS data is to be believed, the top 10 warmest years on the planet have all occurred between 1998 and 2012.
The first decade of this century was the warmest decade ever, with 2005 and 2010 having the distinction of being the warmest years in the planet’s history. 2012, on the other hand, was the ninth warmest year to be recorded.
Interestingly, 2012―which features at the ninth position in the list of warmest years―was the warmest year on record for the contiguous U.S., according to the National Climatic Data Center (NCDC) of the National Oceanic and Atmospheric Administration (NOAA).
Furthermore, the data compiled by the U.S. Global Change Research Program reveals that the temperature in the United States has increased by 2°F in the last 50 years. During the same period, the country also witnessed 5 percent rise in precipitation.
Regardless of which study you take into consideration, you will find carbon dioxide concentration topping the causes of global warming. An enormous amount of carbon dioxide is released in the atmosphere as a result of numerous anthropogenic activities, including the use of vehicles and industrial waste. Statistics reveal that coal alone constitutes for about 90 percent of the carbon concentration in the Earth’s atmosphere.
Atmospheric concentration of carbon dioxide has soared from 280 parts-per-million (ppm) in 1880 to 392.6 ppm in 2012. More recently―on May 9, 2013 to be precise―the same crossed the 400 ppm mark for the first time. Since then, however, it has been below the said mark.
If scientists are to be believed, the levels of carbon dioxide in the Earth’s atmosphere could reach as high as 970 ppm at the ongoing rate, which, mind you, is just a conservative estimate.
In the United States, carbon dioxide accounted for 84 percent of greenhouse emissions from anthropogenic activities in 2011. At 32 percent, the combustion of fossil fuels for power generation is the largest source of carbon dioxide emissions in America.
Carbon dioxide is, however, just one of the numerous greenhouse gases which contribute to the global warming phenomenon. Other gases include water vapor (36 – 72 percent), methane (4 – 9 percent), ozone (3 – 7 percent) etc.
With a net lifetime of 8.5 years, methane plays a significant role in fueling the rise in the average global temperature. If we stop all the activities which release methane in the atmosphere at this very moment, it will take about 8.5 years to get rid of it from the Earth’s atmosphere.
Glacial melting is one of the most prominent evidence of global warming. The Glacier National Park in Montana, USA, is left with only 27 glaciers today; down from 150 in 1910. Furthermore, if the predictions made by the U.S. Geological Survey (USGS) are to be believed, the Glacier National Park will be devoid of glaciers by as early as 2030.
Another example is that of the glaciers in the Himalayan mountain range. A study related to global warming and melting glaciers by the IPCC revealed that the Himalayan glaciers will be gone by 2035. Glacial melting will not just affect the supply of drinking water, but also cause flash floods in this region, thus leaving thousands of people homeless.
A similar condition is seen in the polar areas, where ice caps are melting rapidly as a result of unusually warm climate. Scientists are of the opinion that Greenland and Antarctica are losing thrice the amount of ice they used to in 1990s.
The Arctic Ocean will be free of summer ice by 2100. While many scientists would agree with that, there are some who suggest that this is more likely to happen between 2060 – 2080.
Melting glaciers and polar ice caps are causing the sea level to rise. If the data compiled by the U.S. Environmental Protection Agency (EPA) is to be believed, a rise of 6 – 8 inches has been seen in the sea level across the world. If the ice caps in Greenland melt, it will cause the ocean to rise by about 20 meters.
The most obvious abnormalities in weather can be seen in context of drought and precipitation patterns. The percentage of land affected by droughts worldwide has doubled from what it was in 1970s. In the United States, an estimated 30 – 60 percent of land is subjected to drought at any given time of every year.
While the world has experienced a rise in the amount of precipitation by 2 percent per decade, the same for the United States has been approximately 6 percent per decade. Similarly, the frequency of heat waves in the United States, which had gone down in 1960s and 1970s, has suddenly shot up.
Statistics published in the environmental journal, Nature, reveal that the frequency as well as the intensity of hurricanes has increased by a considerable extent over the last 30 years. If we go by estimates, every 1.8ºF rise in the surface temperature of the ocean results in 5 percent increase in the intensity of hurricanes.
Everybody is bearing the brunt of climate change; plant and animals are no exception. Over the last 150 years, the planet has lost around 40 percent of its forest cover, and seen a rise of 30 percent in terms of desertification.
Around 15 – 37 percent of plant and animal species inhabiting the Earth are likely to be wiped out as a result of global warming by 2050. A look at the list of extinct animals reveals that more than 50 species have become extinct over the last century alone; things are just expected to get worse with time.
Amphibians are by far the worst affected by global warming, with climate change resulting in habitat destruction for them. Around 52 percent of amphibians are believed to be vulnerable to the effects of the phenomenon. So are 35 percent of bird species on the planet.
Even mammals are at the receiving end when we talk of global-warming casualties. In 2007, the USGS estimated that the polar bear population would decrease by two-thirds by 2050, as a result of sea-ice decline. The species was enlisted as a threatened species under the Endangered Species Act in 2008.
Global warming is taking its toll on coral reefs as well. It’s estimated that around 71 percent of these reefs are vulnerable to climate change. On an average, we are losing 1 percent of coral reefs every year. The Caribbean―a coral heaven at one point of time―has lost 80 percent of its reefs over the last 30 – 40 years.
You can dismiss these stats as exaggerated numbers, but the fact remains that global warming is happening, and that’s becoming more and more obvious with every passing moment. It’s high time we start working on solutions; doomsday is just round the corner.


